July 19th, 2024
8 Statistical Analysis Examples to Help Your Research
By Zach Fickenworth · 8 min read
Analyzing incoming data to make conclusions, draw insights, and create predictions is one of the cornerstones of modern industries, science, and finance. If you’re on the road to becoming a data analyst, then you probably already have a cursory understanding of the various statistical analysis methods that transform raw data into useful information.
However, you can get much more from examples, allowing you to apply the theoretical knowledge in practice. Read on to discover the vital steps in the statistical analysis process and how different methods are applied to draw various conclusions.
Importance of Statistical Analysis Examples
You need a deeper understanding of statistical analysis methods to be able to perform the right analysis at the right time. That’s where examples can shine. Here are some of the key reasons you should base your learning on examples:
- It allows you to take concepts you’ve learned and apply them to similar environments.
- They’re more interactive methods of learning than rote theory.
- Examples help you visualize the results of data analysis better and correlate them to real-world applications.
- Using examples can prove that the decision-making process based on them is the correct one, leveraging actionable insights.
- Examples can showcase the best approaches for solving common problems in data science and analysis, leading to a better understanding of the various concepts and more versatility.
8 Statistical Analysis Examples to Learn From
Here are some key examples of statistical analysis concepts that will help you grasp the logic behind them.
Exploratory Statistical Analysis: The First Look at Data
After the initial data collection, an exploratory statistical analysis (or, exploratory data analysis – EDA) helps you understand what information you’re working with and how it can be used to create insights. It focuses on the main characteristics of your data set and the potential conclusions you can draw. An EDA can also be helpful to determine which data points will be used for analyzing the information, or whether you lack critical information.
For example, an EDA in a study of customer retention statistics will require multiple statistics on each customer, such as their age, gender, earnings, and location, as well as platform-specific information like last log-in or use time. The EDA can help you determine whether you can group customers in certain demographic buckets or if you need to collect additional information on some clients.
Statistical Analysis: From Hypothesis to Results
The bulk of your statistical data analysis will come in the form of descriptive analysis, i.e., determining the criteria for how certain variables in a study perform against others. Based on the information gathered during data collection, these statistical tests will determine the average and median customer scores and time spent on the platform or using the products or services.
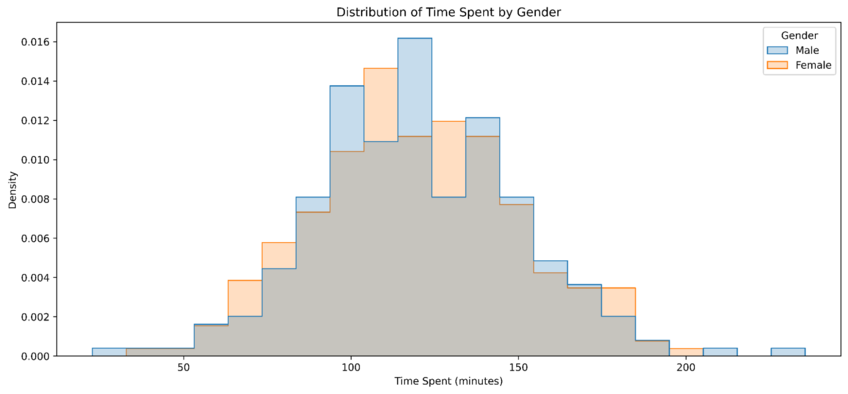
The descriptive analysis will also show the demographic influences on retention and help you identify trends in your population samples. From then on, you can create various hypotheses. For example, does customer retention vary by age and gender, and how, i.e. do male customers spend more time on the platform? Hypothesis testing is a vital step in the process, guiding the entire statistical analysis. Even if you don’t prove the hypothesis, it means that there’s likely a different one that has merit.

Example distribution investigating whether males spend more time on an online platform. Created in seconds with Julius AI
Another example is the deviation calculation, showing how much each data point varies from the median or average value. This calculation can be quickly done using a statistical analysis tool such as Excel or Julius AI.
Predictive Analysis: Forecasting the Future
After the statistical analysis creates tangible theories and results of your hypotheses, you can go a step further. For the customer retention example, you can use the information you already have on existing clients to perform predictive statistical analysis on a new variable. This type of analysis forecasts the behavior of new variables, such as getting more customers in a different location, creating new products or services, and potential sales.
Descriptive Analysis: Painting a Clear Picture
A descriptive analysis considers the main features of a given dataset and how they’re influenced by external variables. For our example with customer retention figures, this typically involves charting the average, median, and outlier statistics regarding the figures you’re tracking (such as customer sales figures and demographic variables).
Prescriptive Analysis: Guided Decision-Making
Prescriptive statistical analysis deals with solving problems based on the current data set. For example, given a group of clients, a prescriptive analysis can guide the sales team toward which set of products or services to recommend. This analysis leverages descriptive and predictive analytic methods to determine several possible courses of action and possible outcomes. This strategy allows you to optimize your results given a currently unknown variable (such as a new client).
Data Visualization: Charts, Graphs, and Insights
Interpreting vast data sets often doesn’t come easy. Crawling through raw results can lead to a lack of tangible conclusions or data points that seem all over the place. Data visualization techniques help transform this data into easy-to-understand graphics such as charts and graphs. These can present the results and findings in a concise format that makes it easy to see the best ways to proceed given the findings of your hypotheses and obtained statistics.
Time Series Data Analysis: Tracking Changes over Time
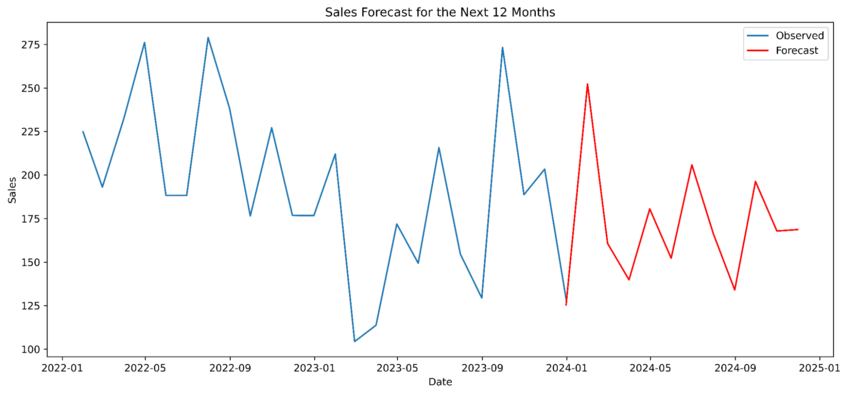
One of the simplest examples of a time series analysis is historical data on customer purchases or subscriptions, and how they’re affected by outside variables or trends. The time series analysis can help you determine trends or fluctuations in your data, or even point you towards periodic data performance (such as repeating trends or seasonal shifts in sales).

Example time series data analysis to forecast sales for the next 12 months. Created in seconds with Julius AI
Textual Analysis: Unraveling Words and Sentiments
Often, you won’t only work with numerical information. Textual information has become more important than ever. For example, companies might need to perform keyword extraction and analysis to determine which are the most positive keywords that their offer ranks for.
For the customer retention example above, a textual analysis will be pivotal in transcribing the customer feedback you’ve collected (which often comes in textual form). Together with a scoring system in place, a textual analysis can determine the most pressing problems that the company needs to solve.
How to Make the Most of Your Analysis
If you want to get the most actionable insights from your data, follow these guidelines:
- Create a hypothesis before collecting data: This process will guide you on which data points to keep, which can streamline and speed up the entire analysis.
- Leverage statistical software: Tools can expedite all the stages of the process, from collection to cleaning to analysis to visualization. Most tools also have many other data analysis techniques which can allow you to test different hypotheses.
- Don’t be afraid to ask for help from your peers or leverage AI to give you more information and tutorials on the topic that you’re struggling with.
Get Julius AI and Make Statistical Analysis Simple
One of the quickest ways to perform a statistical analysis is to use an AI chatbot like Julius AI. The chat input allows you to bypass learning various programming languages used in the most common statistical software solutions. With a chat-like tool, all you have to do is upload the data set and ask the AI to perform various transformative methods to interpret them.
Julius AI is incredibly quick and can work with data in healthcare, education, academia, and finance. Start chatting with Julius AI today and learn why it can be a data science student’s best friend.
Frequently Asked Questions (FAQs)
How to choose a statistical analysis method?
Choosing a statistical analysis method depends on the type of data you have and the questions you aim to answer. Start by identifying whether your data is categorical or numerical, then determine your objective—describing data, testing hypotheses, or making predictions. Tools like Julius AI can guide you by suggesting appropriate methods based on your dataset.
What is the simplest statistical analysis?
The simplest statistical analysis is descriptive analysis, which summarizes data using measures like mean, median, mode, and range. It helps provide a clear overview of the data without requiring complex calculations or advanced software.
How do you present statistical analysis?
To present statistical analysis effectively, use clear visuals like charts, graphs, and tables to highlight key findings. Complement these with concise explanations that connect the data to actionable insights, tailoring the presentation to your audience’s level of expertise. Tools like Julius AI can assist by generating intuitive visualizations and summaries.
