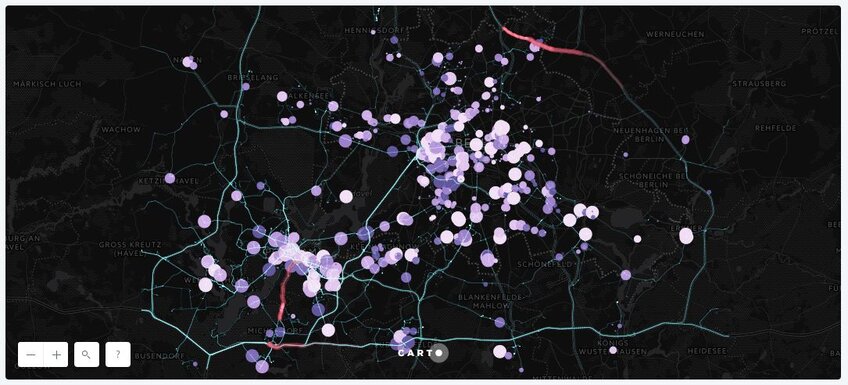
July 15th, 2024
What Is Spatial Analysis in Statistics?
By Connor Martin · 12 min read

Used in everything from agriculture to urban development, spatial analysis is an integral element of statistical study. It harnesses the power of emerging technologies to reveal invaluable insights about the world around us.
This guide breaks down what spatial analysis statistics are and how this analysis works.
What Is Spatial Analysis?
To understand spatial analysis statistics as easily as possible, we need only break the term down into its two key components:
- Spatial – Referring to the concept of space or location
- Analysis – Referring to the close study or examination of something
So, spatial analysis, in the simplest of terms, revolves around the study of entities or objects, based on their locations.
It involves the examination and evaluation of an object or entity’s spatial data features to learn about it. Those features, or data points, can include the entity’s location, geographic relationships, and geometric attributes.
A broad array of analytical methods, models, and techniques are employed in pursuit of spatial analysis statistics.
A simple example of this idea in action would be an urban planner, looking into the idea of where to construct a new city park. They might employ various statistical methods and examine multiple spatial analysis statistics – like population densities and traffic patterns – in order to identify the prime location.
Why Is Spatial Analysis Important?
By gathering spatial statistics, we can learn so much more about the world around us. We can discover spatial patterns, for example, understand geographic and geometric trends, and, perhaps most importantly, use all that spatial data to make informed, accurate decisions.
Returning to the previous example of an urban planner, they can use geographic data and spatial datasets to, for instance, pinpoint areas of a city with higher levels of crime. They can then study spatial relationships to potentially explain why those areas have higher crime rates than the rest. Then, they could go one step further, using spatial statistics to suggest potential changes or improvements that might help to bring the rate down.
That’s just one example. There are so many other ways in which spatial analysis can be put to good use, not merely in city planning, but in other areas, too. It’s an invaluable source of information, as an entity’s location often has so much to tell us, and that data can only be revealed through the study of spatial statistics.

Example chart that shows the locations of crime incidents in the city, with each point representing a crime incident. The red points indicate the geographic coordinates of the incidents, and the base map provides context for the city’s layout. Created in seconds with Julius AI
How Does Spatial Analysis Work?
We’ve seen what the term spatial analysis refers to, and some of the value it brings. Now, let’s look at how it works, breaking the spatial process down into three key steps:
Step #1 - Data Collection
Data collection is, understandably, a critical part of spatial analysis – we have to first gather data before we start to analyze it. A range of methods and modern technologies may be used in the collection of spatial data, including the likes of LiDAR (light detection and ranging) devices, as well as satellites. Examples of collected data can include photographs, maps, and census data.
Step #2 - Data Analysis
Next, all the geographic data gathered in the first step needs to be analyzed. This is the heart of what spatial analysis is all about – taking geometric and geographic info and studying it to draw out trends and insights. These days, artificial intelligence (AI) and machine learning (ML) technology are primarily used to carry out this analysis much more quickly and precisely than any human could.
Step #3 - Data Presentation
With the data gathered and analyzed, the final part of the spatial process is to present the findings of the analysis.
Naturally, visualization methods – charts, graphs, tables, diagrams, etc. – are often used during this process to display somewhat complex spatial relationships and patterns in an easy-to-understand way.
Pros and Cons of Spatial Analysis
As with any subfield or aspect of statistics, spatial analysis has its benefits, along with its drawbacks.
Pros
- Reveals Patterns and Insights: Through geographic data analysis, we can discover hidden patterns, trends, and spatial relationships in cities, towns, and other geographic areas.
- Allows for Informed Decision-Making: Spatial statistics often reveal useful and actionable data that can help people and businesses make smart, informed decisions.
- Versatile Applications: The list of potential applications of spatial analysis statistics is long, and growing longer by the day as analytical technologies improve.
Cons
- Risk of Errors and Inaccuracies: There’s always a risk of inaccuracy in spatial statistics. The data has to be sourced properly and comprehensively to produce accurate analysis.
- Costly Data Collection and Analysis: Given the technologies involved – LiDAR scanners, satellites, and AI, to name but three – spatial statistics can be quite costly to explore.
- Degree of Complexity: Spatial analysis is a complex concept, demanding a certain level of technical expertise and experience to conduct effectively.
Applications and Examples of Spatial Analysis
As touched on above, spatial statistics can be used across a wide section of industries and fields. Some examples include:
- Urban planning: Understanding spatial interaction and spatial characteristics is paramount for informed and effective urban planning. It can be used for everything from deciding on the right place to build a new hospital to addressing rising crime rates, improving traffic flow in crowded areas, and so much more.
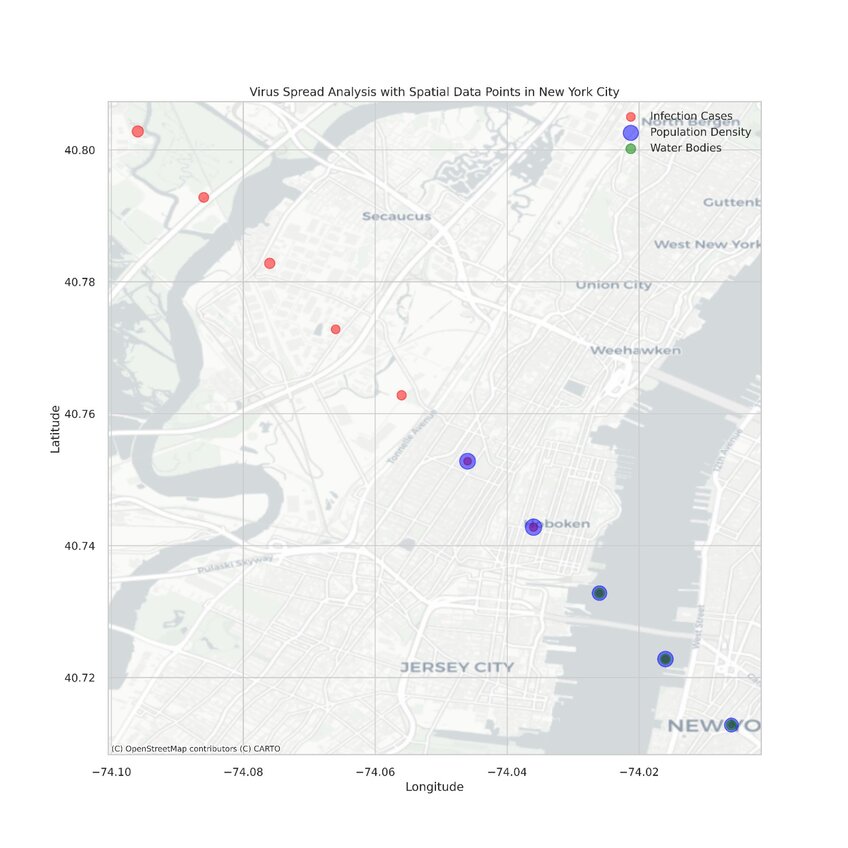
- Public health: Spatial pattern analysis is employed in the field of public health. If a virus starts to spread, for example, spatial statistics can be gathered to track that spread and better understand it, taking into account a range of spatial data points like weather, population density, presence of water bodies, and more.

Example spatial analysis that shows the spread of a virus in New York City with points representing infection cases (red), population density (blue), and water bodies (green). The size of the points indicates the number of cases, population density, and the presence of water bodies, respectively. The base map provides context for the geographic layout of the area. Created in seconds with Julius AI
Tips for Conducting Effective Spatial Analysis
- Set Your Objectives: Before digging into any form of spatial data collection, you have to know why you’re doing it, and what you’re looking for. Establish a clear objective before you begin.
- Quality Data: In spatial analysis – and other statistical analysis formats – the quality of data is of the utmost importance. Use the right tools and methods to ensure quality data collection.
- Validate Your Data: Always check and re-check your analysis methods and steps to minimize the risk of any errors and confirm your findings.
- Use the Best Tools for the Job: The better tools you use, the better-quality data you’ll be able to gather and the more detailed your analysis will be. Focus on quality AI solutions for best results.
Make Spatial Analysis Straightforward and Stress-free with Julius AI
Without a doubt, spatial analysis statistics have a lot to tell us about our surroundings, and spatial analysis is a remarkably powerful, versatile tool. However, as mentioned earlier, it’s also quite complicated.
Fortunately, there is an easier option. With Julius AI, analyzing spatial statistics is as easy as A-B-C. You simply enter your data set into the AI tool, along with a simple prompt, to conduct expert-level analysis in a matter of seconds.
Frequently Asked Questions (FAQs)
What are the methods of spatial analysis?
Spatial analysis employs methods like spatial autocorrelation to measure relationships, spatial interpolation to estimate values at unobserved locations, and hotspot analysis to identify clusters of activity. Techniques like network analysis and spatial regression are also used to study spatial relationships and trends.
What is the function of spatial analysis?
The function of spatial analysis is to evaluate and interpret spatial data to uncover patterns, relationships, and trends tied to geographic locations. It helps inform decisions by analyzing spatial interactions, identifying key areas of interest, and providing actionable insights across fields like urban planning, public health, and environmental science.
What is a spatial classification in statistics?
Spatial classification refers to categorizing spatial data into distinct groups or categories based on shared geographic or statistical attributes. This process is used to segment areas or entities, such as dividing regions by population density, land use, or disease prevalence.
What are the statistical techniques in spatial analysis?
Statistical techniques in spatial analysis include spatial autocorrelation to measure the degree of similarity in nearby areas, kriging for advanced interpolation, and geographically weighted regression (GWR) for localized modeling. Other techniques include cluster analysis to detect patterns and point pattern analysis to study spatial distributions.
