March 6th, 2024
What Is Sensitivity Analysis in Statistics & How Is It Used?
By Connor Martin · 9 min read
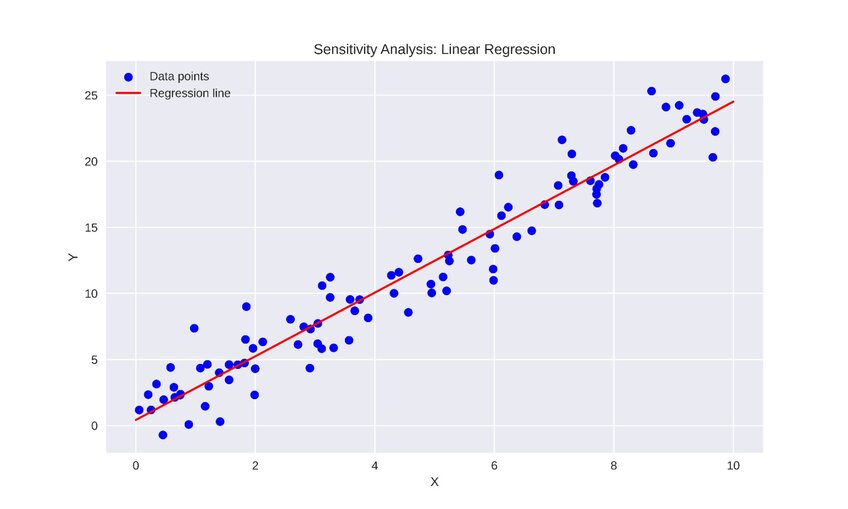
Numbers and data don’t lie, but, when you carry out analysis of that data, a range of variables and factors may influence the outcomes of that analysis. Sensitivity analysis statistics help you understand and even visualize the impact of those variables.
Thus, sensitivity analysis is a crucial tool for assessing the overall robustness and reliability of any study’s findings. This guide breaks down what sensitivity analysis statistics are and the benefits they bring.
What Is Sensitivity Analysis?
First, a definition. Sensitivity analysis is, in simple terms, the process of working out how different variables impact the end result of a study or test. It involves analyzing those variables closely, and assessing how a change in one or more variables may affect the overall outcome.
In essence, sensitivity analyses are about asking “What if?” – “What if variable X was a bit bigger?” or “What if we cut variable Y in half, what would happen?” They’re even sometimes referred to as “What if?” tests by those who use them.
In short, it’s about exploring possibilities, and it’s beneficial in a vast array of scenarios, from scientific research to the world of finance (more on that below).

How Does Sensitivity Analysis Work?
How sensitivity analysis statistics are gathered and used will vary from industry to industry and field to field.
However, the general principles remain the same:
- Researchers must first identify variables that impact their outcomes.
- Then, they explore the effects of those variables.
This may involve processes like repeating a study numerous times or using other, pre-existing data to estimate the impact of altered variables.
Let’s look at an example to see the concept in action more clearly.
Imagine medical researchers are testing the effectiveness of a new medication. Their clinical trials up to that point suggest that the drug has a positive impact on recovery times and symptom reduction. However, they wish to carry out a sensitivity analysis to deepen their understanding.
The primary analysis would begin by identifying variables from their study that could have influenced the end results. Then, they explore those variables.
As an example, they might have initially run clinical trials on people within a certain age bracket. They may like to explore how the presence of older or younger participants may impact the results, so they could run the test again with a broader selection of age groups.
Alternatively, perhaps their initial study used the drug in a set dose every time. They may want to see how slightly smaller or larger doses affect its effectiveness.
By asking these kinds of “What if?” questions and finding sensitivity analysis statistics to answer them, the researchers gain additional insight and information about their subject of study.
How & Where Is Sensitivity Analysis Used?
Sensitivity analyses aren’t just relevant for scientific studies. They have far-reaching, widespread applications across multiple industries.
Scientific Research
Scientific researchers regularly use sensitivity analysis statistics to expand their understanding of study subjects. As the previous example illustrated, they might expand clinical trials of a drug to account for an array of variables, like dosage or the age, gender, and health state of the participants.
Climate Models
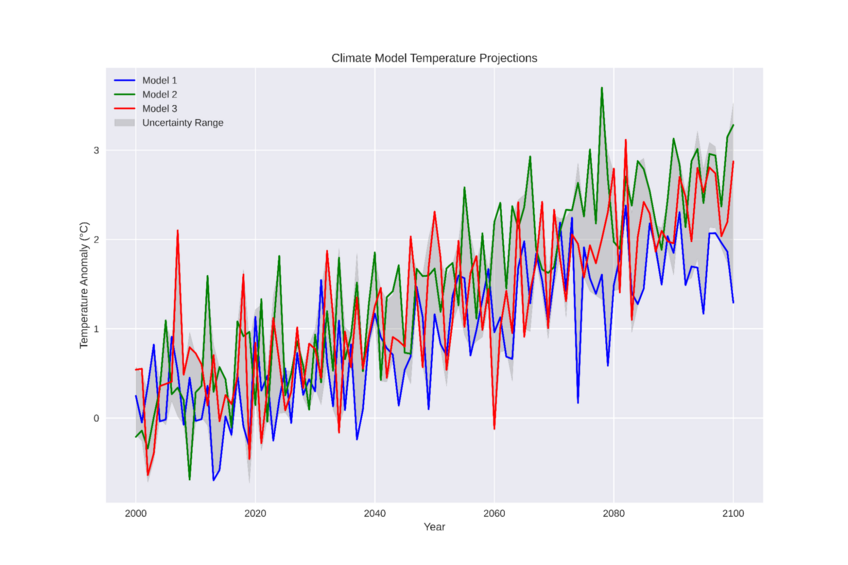
Sensitivity analysis may apply to climate models and projections of how climate could change in the future. Naturally, at a time when climate change is under such close scrutiny, this is particularly important.
For example, it’s widely understood that carbon emissions cause gradual increases in global temperatures. But we can dig deeper into this concept through sensitivity analysis, exploring how changes in variables, like the amount of emissions or the expansion of industry, might affect the rate of temperature rise.

Business ROI
Sensitivity analysis statistics are also highly prized by those in business and finance. They can help companies make informed and intelligent investment decisions to maximize their ROI (return on investment).
As an example, a company prepares a marketing drive for a new product. They estimate a 20% ROI. To determine if there’s a better way to boost their ROI, they conduct sensitivity analyses, looking at how conversion rates and ad costs could impact the outcome.
Engineering
In the field of engineering and infrastructure, sensitivity analysis often helps to make small but crucial changes or improvements to a design or concept.
For example, imagine engineers are planning to build a bridge that needs to withstand a certain amount of weight. They conduct sensitivity analysis to see how other variable factors, like wind speed and changes in weather conditions, impact the bridge’s structural integrity, and how different materials might make the final product more or less stable.
Tips for Sensitivity Analysis
Sensitivity analysis statistics are invaluable for discovering and deepening our understanding of any study or piece of research. But, to maximize the value of statistical analyses, they have to be carried out correctly. Here are some tips to help:
- Focus on Key Variables: It’s easy to get overwhelmed when commencing a sensitivity analysis, considering the dozens of potential variables to examine. Ignore those that are less influential and focus on a few key factors that you deem to have the biggest impact on the outcome.
- Be Reasonable with Your Ranges: When you’re looking at how a variable might impact the result if it were bigger, smaller, broader, or narrower, be sensible and realistic with how far you push it.
- Harness Emerging Technologies: Emerging tech tools, like artificial intelligence (AI), make sensitivity analysis and other forms of stats analysis dramatically simpler. Identify and use these tools to help with your variable study and results visualization.
Make the Most of Your Analysis with Julius AI
Whether you’re seeking to make the most of an investment or digging into the nitty-gritty of a scientific study, sensitivity analysis will help you. But it can be tricky and time-consuming to carry out correctly. Julius AI is here to help.
As the most advanced AI data analyst, Julius AI can assist with all major aspects of stats analysis, including identifying variables for your sensitivity analyses, generating visuals to display your findings, and much more. Give it a try today and take your analysis to the next level.
Frequently Asked Questions (FAQs)
What is an example of a sensitivity analysis?
An example of a sensitivity analysis is examining the impact of different dosage levels of a new medication on patient recovery times in a clinical trial. Researchers might vary the dose and observe changes in outcomes to determine the optimal dosage for effectiveness.
What is the sensitivity analysis method?
The sensitivity analysis method involves identifying key variables that affect the outcome of a study, systematically altering these variables, and analyzing the resulting changes in the outcome. This helps researchers understand the influence of each variable and the robustness of their findings.
How is sensitivity measured in statistics?
In statistics, sensitivity is often measured by calculating how changes in input variables lead to changes in the output of a model. This can be quantified using metrics like partial derivatives, scenario analysis, or through simulations that assess the variability of outcomes under different conditions.
