December 10th, 2024
8 Best Free Open-Source Data Visualization Tools
By Connor Martin · 10 min read
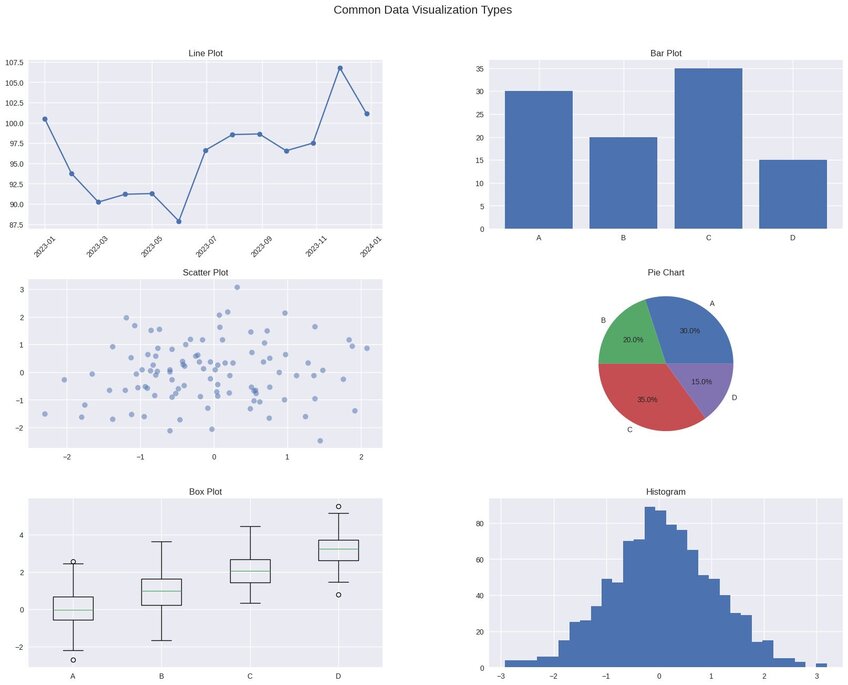
You want to build interactive charts and create interactive timelines using your data. There’s just one problem – you’d have to pay a considerable amount of money to do it with the visualization tools you’ve found so far. If only there were a free data visualization tool that could help you display complex data in the way you need it for your project.
There is.
In fact, there are several. Let’s take a look at eight of the best open-source data visualization tools to try in 2024.
What Are the Eight Best Open-Source Data Visualization Tools to Try in 2024?
1 – Julius AI
Creating charts and conducting complex data analysis with Julius AI is as simple as asking a few questions. The platform allows you to upload your data sample and interact with it using a handy chat interface. Your requests lead to the creation of sleek visualizations that highlight the most important takeaways from your datasets – all crafted using artificial intelligence.
That’s one of the best things about Julius AI – it delivers visualizations for complex datasets without bogging you down in your own data.
2 – Google Charts
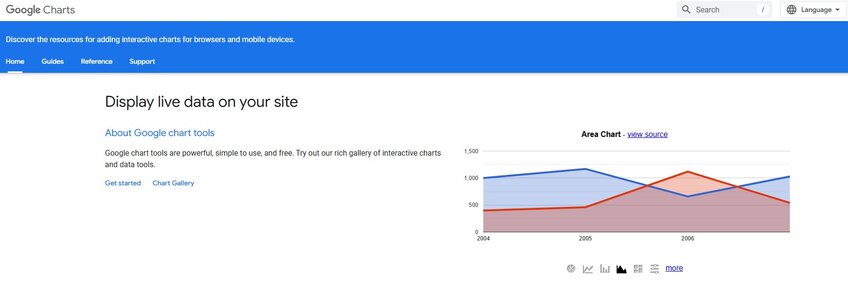
A vast library of charts and an app powered by the cloud are the main reasons we recommend that you check out Google Charts. It’s a browser-based platform that you can access from practically anywhere with a compatible device. Plus, you can customize your visualizations as much (or as little) as you like, and Google Charts’ default options can all be tweaked with your branding.
3 – Chartbuilder
Chartbuilder keeps things simple. Available via GitHub, it lets you either build XY charts or design a chart grid. You can input data into the app manually or upload a .json file. Then, you set a handful of options, such as column ordering and coloring, and Chartbuilder makes your chart. It’s as simple as that. The option to export your creation as an image, SVG, or .json file is the icing on the cake.

4 – Gephi
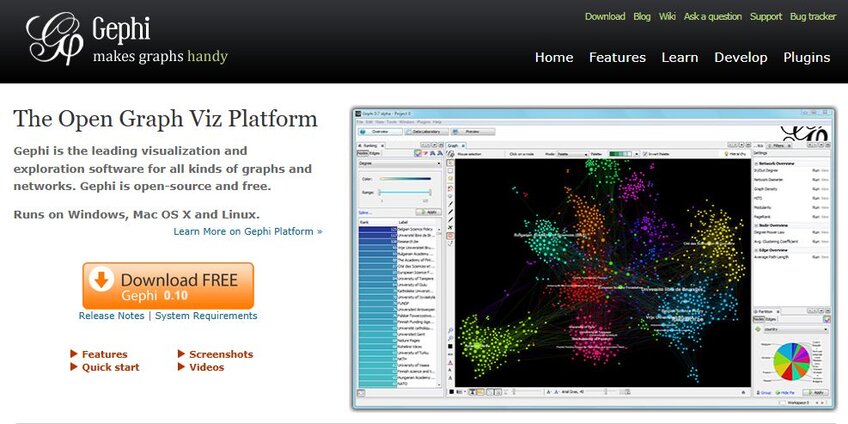
Unlike the tools we’ve covered so far, Gephi is a desktop app. It’s downloadable on Windows PCs, Macs, and Linux. And it’s pretty powerful as long as you stick to relatively simple data analytics. The tool lets you tweak structures and colors when you’re creating charts. We’re also big fans of its “Social Network Analysis” tool, which can help you map the connective tissue behind specific groups on a platform. That’s great for marketing – you can map out what you need to know about a group to appeal directly to its members.
5 – Redash
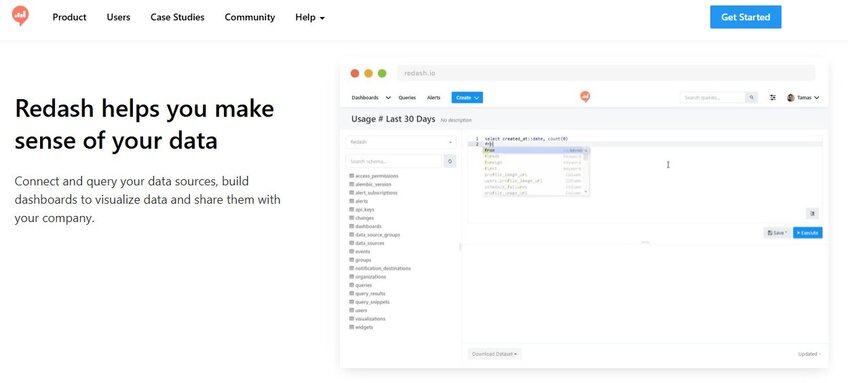
SQL fans will love Redash because it runs on an SQL server and features its own SQL editor. Of course, that narrows down the list of who can use the tool. You have to know some SQL to get the most out of it. However,t using SQL makes the tool versatile enough to offer pie and bar charts, scatter graphs, and a bunch of other interactive data visualizations.
6 – Dygraphs
The open-source JavaScript library packed into Dygraphs is just one of the many reasons why we recommend this free data visualization tool. It’s also great for larger datasets. It also offers support for error bars, which are handy tools you can use to estimate how accurate your generated charts really are. Throw in some tutorials, and it’s fair to say that the app does as much as it can to be accessible to newcomers.

7 – RawGraphs
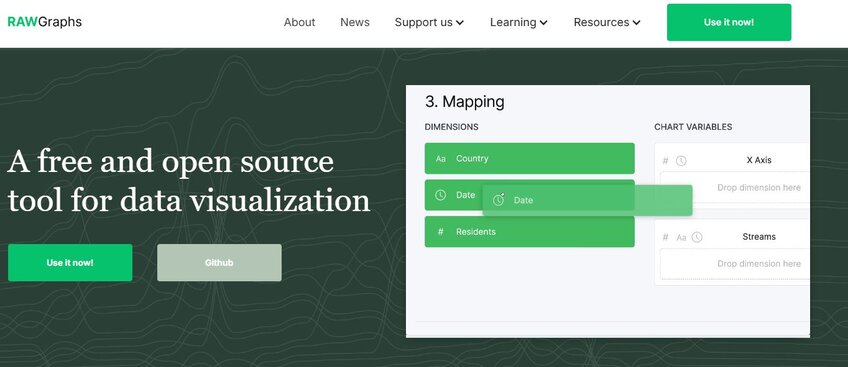
Speaking of newcomers, they’re precisely the market that RawGraphs targets with its automated data visualizations. It’s similar to Julius AI in that respect. You paste or upload your data into RawGraphs, and it’ll give you some options to tweak how you want to visualize your sample. Click a button, and it will do the rest. For more experienced data scientists, the app also offers a toolbox for building more customized data visualizations.
8 – Candela
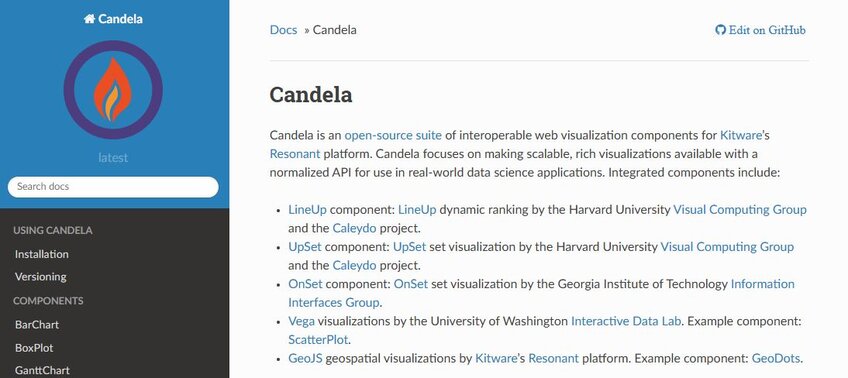
If ReDash is the best free data visualization tool for SQL users, Candela ticks that “best” box for people who are already familiar with JavaScript. It packs several interoperable data visualization elements into its package, and its output is always clean and clear. There’s just one problem – you have to integrate the app into a web page for it to work properly. Candela gives you guides on how to do this using JavaScript, Python, and R. However, this added hurdle means it may not be the best choice for a newbie.
Benefits of Data Visualization Tools Today
The key benefit of data visualization tools is baked into the name. These tools allow you to see what your data is telling you. The ability to display complex data visually makes it easier to draw insights from complex datasets. Improved data analyses leading to much faster decision-making is the result.
Plus, creating charts using these tools is a far better way to communicate the points you want to make than trying to explain your data without visuals. In particular, presentations to people who aren’t experts in your field become a lot easier with charts and other forms of data visualization.
What Makes a Data Visualization Tool Great?
For us, it comes down to three elements – speed, simplicity, and the extent to which your tool can explore your data.
A good free tool should deliver data-driven documents like reports and graphical insights in minutes - and do it using a simple user interface. Julius AI’s chat interface is a great example. It allows you to create data visualizations by simply quizzing your data in plain English in a familiar ChatGPT-like interface.
As for the “extent” element, that’s simple. What does your tool of choice actually offer in terms of interactive data visualizations? The more options you have, the better.
Try Julius AI Today and Discover How Easy Data Visualization Can Be
Don’t struggle with complex coding languages to build your interactive charts. Stop paying through the nose for expensive tools to create data visualizations. Trust Julius AI to do it for you instead. Try our AI data analyst for free, and discover how something as easy as chatting with AI can give you one of the best data visualization tools.
