December 15th, 2024
5 Best Alternatives to R (Programming Language)
By Connor Martin · 6 min read
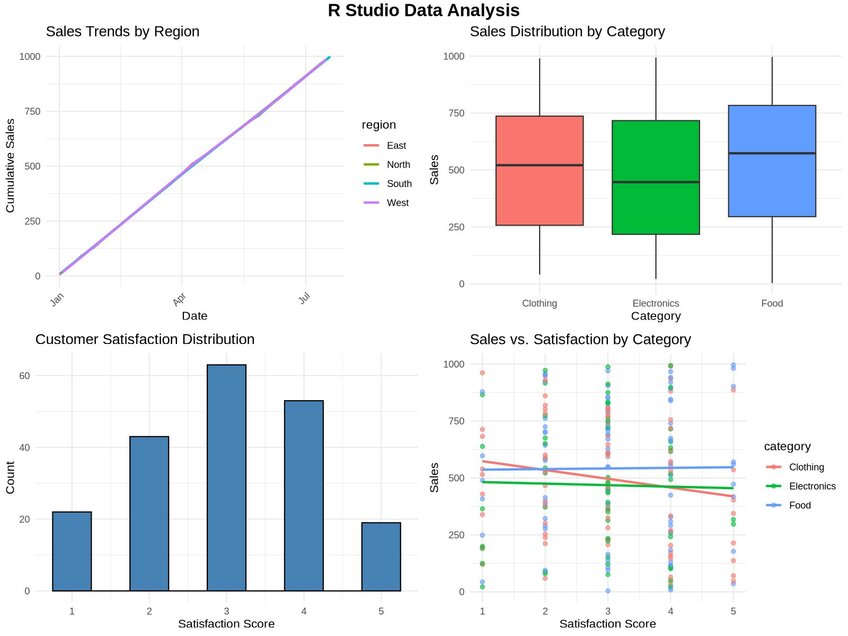
R is one of the superstar languages in the data analysis and data science fields, becoming the primary programming language for many statistics buffs in the process. But it’s far from perfect. For starters, R obviously requires you to have some programming language knowledge before you can generate any insights from your data.
So, you’re looking for some alternatives. Those alternatives could be less complex programming languages, which are compelling alternatives to R because they’re easier for you to get to grips with.
Or you might want to take code completion out of the equation altogether with a data visualization tool that does the hard work for you. Whatever the case may be, let’s take a look at some of the best R alternatives available.
What Are the Five Best Alternatives to R to Try in 2024?
1 – Julius AI
Let’s start with the “no-code” alternative to R. You don’t need any knowledge of functional programming languages with Julius AI. That’s because it functions as a form of ChatGPT for statistical analysis. You upload your datasets into the app. Then, you use the simple chat interface to quiz the app about what your data could be showing you, with results delivered in seconds. Natural language processing does the rest as Julius AI interprets your questions and delivers insights based on the datasets you port into the platform.
Think of Julius as your own AI data analyst. We love it because it can present insights however you need them, be that in a chart, report, or any other data visualization format. Even better, it does all that at high speed. With Julius AI, you’ll spend seconds completing a task that would take hours with R.

2 – Python
If you’re looking to step outside of the statistical analysis arena, R really isn’t the ideal programming language for you. That’s because it’s honed in on that specific area. If you seek versatility, the Python programming language is a much better fit, as you can do a whole lot more with it than you can with R – including statistical analysis and leveraging some of the best Python data visualization libraries. Python’s open-source nature makes it a statistical powerhouse as long as you install the right Python libraries.
Like R, Python is open-source, allowing you to tailor it to your needs. But we think its biggest advantage over R is that it’s an expressive scripting language that uses readable syntax. Many new programmers prefer it to the more complex programming languages out there for that exact reason.
3 – MATLAB
If generating visualizations of plots or data is your thing, MATLAB is a great choice. It’s a high-level programming language that was originally designed to help you access matrix software created by the EISPACK and LINPACK projects. However, for many who are seeking alternatives to R, MATLAB’s fatal flaw is that it is a closed-source programming suite.
That means you’re going to pay a lot more to use MATLAB than you would for the open-source R. Still; it offers object-oriented programming features through its use of folders and functions. Plus, it comes loaded with toolkits that can automate much of your programming for you, which lowers your barrier to entry. Just know that it’s not the language of choice if you’re looking to do anything beyond executing mathematical functions, like creating graphs or doing calculus.
4 – SAS
Like MATLAB, SAS comes with the immediate downside of costing you money if you want to use it. The language isn’t open-source like R. However, being a closed-source language does mean you’ll have access to better support than you’d get with an open-source language.
That’s not why we recommend SAS, though. It’s a user-friendly language that is far easier to learn than R, as you’ll discover when you start exploring its simpler syntax. Commands are intuitive to the point where we think SAS is a great choice for the programming newbie. Throw in a suite of solid data visualization tools, including easy-to-access graphs and plots, and you have a solid alternative to R.
5 – Tableau
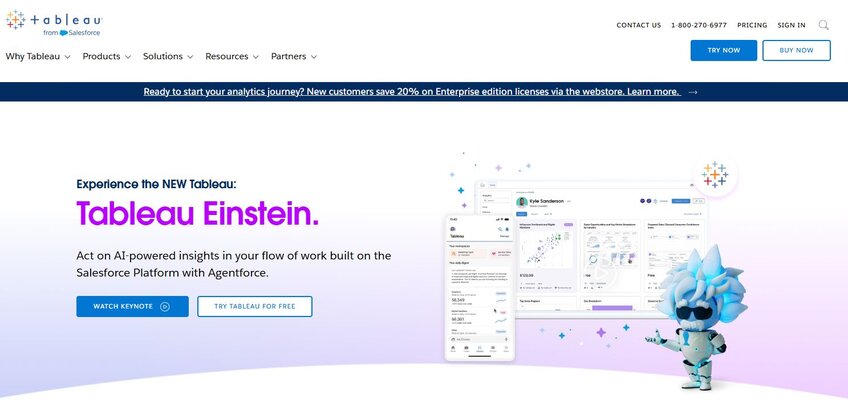
Switching back to no-code R alternatives, Tableau offers you a data visualization tool that essentially handles all functional programming behind the scenes. You just upload your data (the drag-and-drop interface is great for this) and have the platform generate the visualizations you need.
Data engagement is the biggest plus point for Tableau. We love how you can basically build an interactive dashboard around the data you upload. This dashboard allows you to engage with your data without having to cross the programming barrier. Add some handy integrations with other data visualization tools into the mix, and Tableau offers a simpler way to get insights from your data than R.
Understanding R
Maybe you haven’t used R before. Perhaps you’ve just heard that it’s used in data analysis and statistical computing and want to gauge if it’s worth exploring the language or jumping straight to an alternative. Making an informed choice means understanding what R delivers, both the good and the bad.
Pros of R
R is an open-source programming language that’s been around since the 1990s, meaning it has one massive advantage – a huge user base. It’s far from the only programming language that receives enormous support from its users. Python is another. But you’ll always be able to find R packages created by other people to help you with whatever analysis you need to conduct.
Plus, being open-source means it’s free to use, which is a boon for the budget-conscious analyst.
Cons of R
There’s a pretty steep learning curve to overcome if you want to get the most out of R. It’s packed with language-specific data structures. So, you’re going to have to spend hours learning the language before you can start generating insights from your data. That’s a far cry from code-free alternatives like Julius AI that let you jump straight into creating charts and reports.
And though it’s a feature-rich programming language, R can be slow. Really slow. That’s because it’s an interpreted language rather than a compiled one, which creates bottlenecks when you’re working with large datasets.
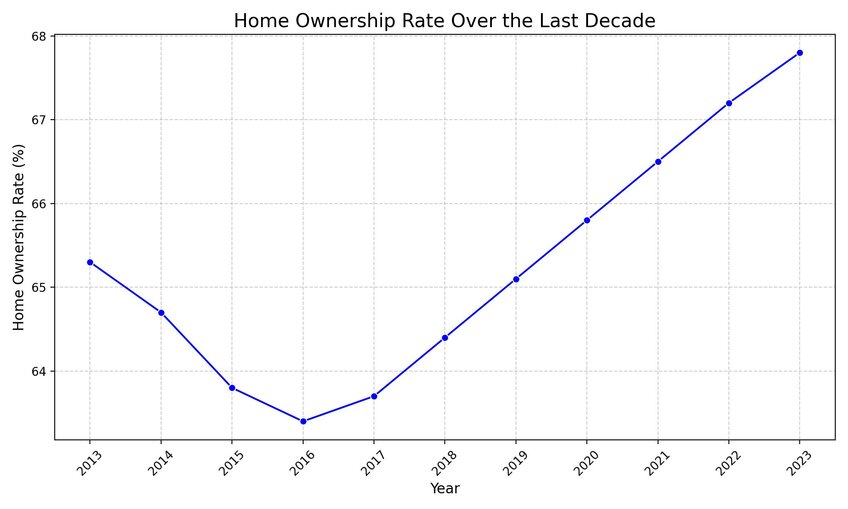
Make Data Analysis & Visualization Easy and Stress-Free with Julius AI
R is great for data analysis if you already have a decent amount of programming language knowledge, or you’re willing to put the time in to learn. But it doesn’t make data analysis and visualization easy for those reasons.
Julius AI does.
With Julius, you just upload your code and project files – or even avoid code altogether – and use the ChatGPT-like interface to ask questions and deliver commands. Everything else is done for you, so you only have to wait seconds to receive expert-level insights into your data.
Try Julius AI today and discover why 1.2 million people are already relying on Julius for their data analysis.
