June 19th, 2024
10 Best Tools for Creating Graphs
By Rahul Sonwalkar · 13 min read

Overview
In today's fast-paced and data-driven world, the ability to visualize data effectively is not just a skill but a necessity across various industries. Whether you're a marketer trying to convey campaign results, a sales rep presenting quarterly achievements, or a data scientist sharing analytical insights, graphs and charts can make your data come alive, telling compelling stories that words alone cannot convey. However, not everyone has the expertise of a professional designer to create visually appealing data visualizations. This is where DIY data visualization tools come into play, offering an easy and efficient way to create stunning graphs that can impress any audience.
Data visualization tools have become indispensable in translating complex data sets into visual narratives that are easy to understand and engaging. With an array of software available, choosing the right tool can be daunting. This blog post aims to guide you through the top 10 tools for creating graphs, offering insights into their unique features and how they can cater to your specific needs.
Top 10 Tools for Creating Graphs

1. Google Charts
Notable Features:
- Integration with Google products for a unified experience.
- Real-time data display capabilities.
- Interactive dashboard with a vast template gallery.
2. Databox
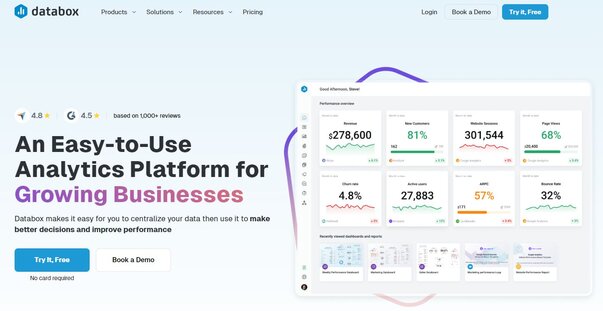
Notable Features:
- One-click integrations with popular marketing tools.
- Pre-built reports and customizable data calculations.
- Dashboard creation for a comprehensive overview of marketing metrics.
3. Julius AI
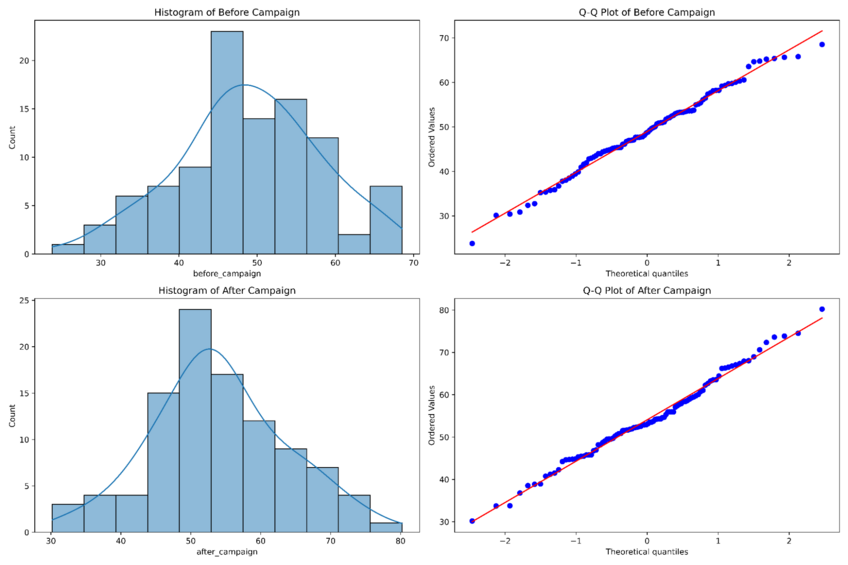
Julius is a standout choice for those delving into data analysis and AI graph making. This platform shines by offering a seamless blend of in-depth data analysis with the ability to generate tailored visual representations. Its interface caters to both novices and seasoned data scientists, enabling a broad spectrum of users to unlock valuable insights from their data sets.
Notable Features:
- Advanced Data Manipulation: allows users to effortlessly import, clean, and manipulate data.
- Custom Visualization Tools: create custom visuals that perfectly illustrate their data stories.
- Python Integration: Julius provides Python support, offering a versatile approach to data analysis and visualization.

4. Tableau
Notable Features:
- Real-time analysis capabilities.
- Support for mobile and desktop devices.
- Extensive customization options through JavaScript extensions and APIs.

5. Plotly
Notable Features:
- Flexible team collaboration options.
- Support for Python, Node, and R languages.
- Custom dashboard and report generation for comprehensive data analysis.
6. ChartBlocks
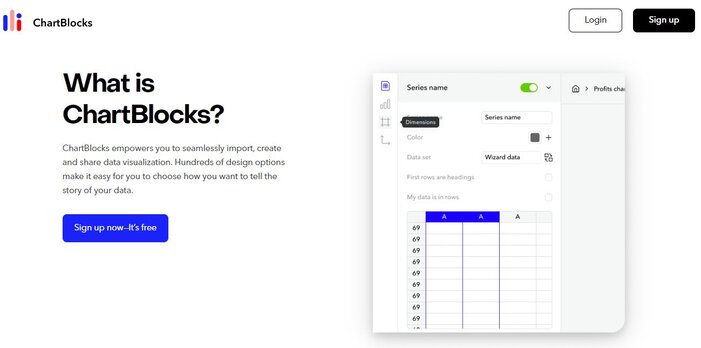
Notable Features:
- Swift data upload and chart generation.
- Versatility in chart creation from a single data file.
- Social media integration for easy sharing.
7. Datawrapper
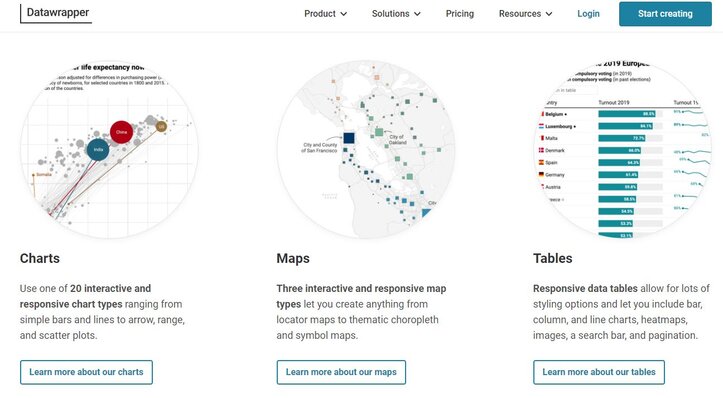
Notable Features:
- A rich selection of premade graphics for quick starts.
- Auto-saving of visual edits.
- User-friendly editing and annotation tools.

8. FusionCharts
Notable Features:
- Extensive selection of interactive charts and maps.
- Customizable designs for personalized dashboards.
- Features like cross-browser compatibility and visual discovery enhance usability.
9. Juicebox
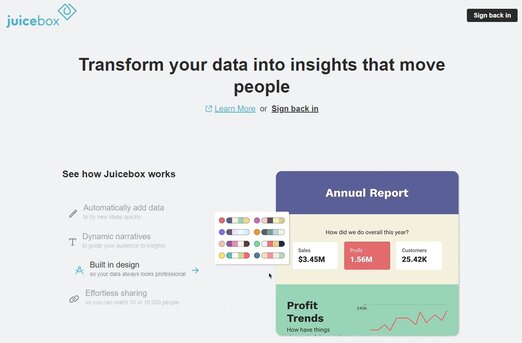
For consultants and knowledge workers looking to impress prospects, Juicebox offers a unique storytelling approach to data visualization, enabling the creation of interactive data stories.
Notable Features:
- Storytelling approach to data presentation.
- Responsive design for attractive displays on all devices.
- Integration capabilities for data pulling from multiple sources.

10. Zoho Analytics
Notable Features:
- Intuitive dashboard for multifaceted data fetching.
- Embedding capabilities for websites and social media.
- AI assistant for enhanced data visualization.
Conclusion
Frequently Asked Questions (FAQs)
What are the 4 main visualization types?
The four main types of data visualization include charts (e.g., bar, pie, and line charts), graphs (e.g., scatter plots and histograms), maps (e.g., heat maps and geographic maps), and dashboards (interactive visual summaries combining multiple data views). Each type serves unique purposes depending on the data and audience.
What is a visualization tool?
A visualization tool is software designed to transform raw data into visual formats like graphs, charts, or maps. These tools make complex information more accessible and engaging, helping users identify trends, patterns, and insights for better decision-making and communication.
How to choose a visualization tool?
Selecting the right visualization tool depends on your data complexity, customization needs, and target audience. Consider factors like ease of use, integration with other platforms, your budget, and the tool's ability to create visuals that align with your specific objectives, whether it’s simple charts or detailed dashboards.
